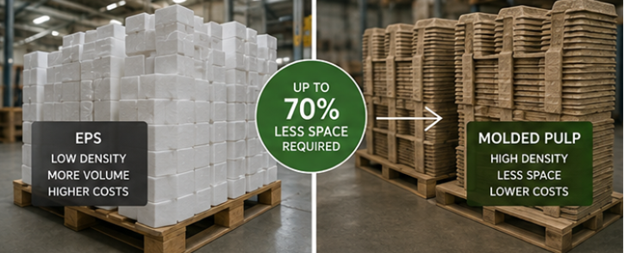
Packaging transitions get sold on sustainability. Sometimes on cost. Rarely on warehouse logistics. Which is strange, because for anyone running a production facility with meaningful packaging volumes, the storage and handling numbers are often the fastest part of the business case to actually prove.
I want to talk about nesting. Specifically, why the nesting properties of moulded pulp packaging should be near the top of every evaluation, and why they almost never are.
EPS takes up a lot of room. More than people realise.
Not when it is wrapped around a product. When it is sitting in your warehouse waiting to be used.
EPS foam packaging nests badly. The wall thickness required to deliver compressive performance in structural industrial applications sits between 8 and 12 mm. That is not a design choice, it is a foam cell density requirement. Go thinner and the compressive strength falls below what you specified. So every unit has 8 to 12 mm of solid foam on each face, and when you stack empty units on a pallet, those walls mean the units cannot get close to each other. A typical industrial EPS corner protector or end-cap achieves a nesting ratio somewhere around 1:3 to 1:4. Four units take the vertical space of roughly three.
Moulded pulp walls in thermoformed wet-press processes run between 1.5 mm and 4 mm. The physics here is simple: thinner walls, units get closer together, more units per pallet height. A properly designed moulded pulp part of similar outer dimensions achieves nesting ratios of 1:8 to 1:12.
On a standard europalette stacked to 1800 mm height, the difference between a 1:4 and a 1:10 nesting ratio for a 320 x 240 x 80 mm corner protector works out to roughly 220 units versus 700 units per pallet position.
That word “properly” is doing a lot of work.
Moulded pulp parts that copy an EPS geometry without any nesting-specific design work will not achieve 1:10. They might achieve 1:4, same as the EPS they replaced, because nobody thought to adjust the draft angles, flange profiles, and cavity taper to actually let the units slide together.
This is where a lot of transitions quietly fail on the logistics side. The packaging passes drop tests, the sustainability story works, the unit cost is acceptable. Then the warehouse team notices that the new packaging takes up the same room as the old one and nobody can explain why.
The reason is that nestability is a design output, not a material property. The material makes it possible. The geometry either delivers it or it does not.
What the storage numbers actually look like
Take a manufacturer holding 50 pallet positions of empty packaging buffer. Normal for a facility running several thousand units per shift.
At EPS nesting ratios, those 50 positions hold roughly 10.000 to 11.000 corner protector sets. At moulded pulp nesting ratios of 1:10, the same 50 positions hold 33.000 to 35.000 sets. Or alternatively: you need 15 to 17 pallet positions to hold what previously required 50.
Pallet position costs in German and Austrian logistics facilities run approximately EUR 12 to 18 per position per month. Fraunhofer IML publishes benchmarking data on this regularly and those figures have been consistent for several years across their logistics cost studies. At EUR 15 average, freeing 33 pallet positions saves EUR 495 per month. EUR 5,940 per year. Not transformative on its own.
But that is only the static storage cost.
Forklift moves are where it gets interesting
Every time empty packaging moves inside your facility, it costs money. Equipment depreciation, operator time, fuel or electricity. The VDMA methodology for calculating internal logistics costs puts individual forklift moves at EUR 3 to 7 depending on facility type and labour rate. EUR 5 is a reasonable mid-point for most EU manufacturing environments.
If you are moving 400 pallets of empty packaging per month internally, tripling your storage density means you move the same packaging volume in around 133 pallet moves instead of 400. That is 267 fewer moves per month. At EUR 5 each: EUR 1.335 per month. Just over EUR 16.000 per year.
Add inbound freight. A truck carrying nested moulded pulp at 1:10 carries roughly three times the unit count of the same truck carrying EPS at 1:3. Freight cost per unit drops by roughly two thirds. For any supplier relationship with meaningful annual volume, that adds up fast.
Combined, the storage and handling savings for a mid-scale manufacturer in the DACH region typically land between EUR 20.000 and EUR 40.000 per year. Not accounting for any material cost differences, just logistics.
The contrarian point
The packaging industry has spent the last five years making the EPS-to-fibre argument almost entirely on environmental grounds. Recyclability, end-of-life, carbon certification. That framing is legitimate but it creates a slow sales cycle because it invites slow scrutiny: lifecycle assessments, supplier audits, certification chains.
The logistics argument takes an afternoon to calculate. You need three numbers: your current nesting ratio, your pallet position cost, and your forklift move cost. Those numbers exist somewhere in your organisation right now. The business case that follows from them does not require external consultants or certification bodies.
Procurement managers under cost pressure respond faster to a spreadsheet than to an environmental brief. That is just true.
Short answer
Well-designed moulded pulp packaging achieves nesting ratios of 1:8 to 1:12 compared to 1:3 to 1:4 for structural EPS foam. For a mid-scale manufacturer this means 60 to 75 percent less warehouse space for empty packaging buffer, and annual savings of EUR 20.000 to EUR 40.000 in combined storage and handling costs. These numbers only materialise when nesting geometry is treated as a design requirement from the beginning, not assumed as a default material property.
Five things worth knowing that usually get skipped
- Moulded pulp nesting ratios between 1:8 and 1:12 require specific design choices: draft angles typically above 10 degrees, consistent flange geometry, and cavity taper calculated against the adjacent unit’s external profile. Without these, the nesting ratio can match or fall below EPS performance.
- EPS formulations with thinner walls exist and some achieve nesting ratios around 1:5 to 1:6. The trade-off is compressive strength reduction in the thin sections, which must be compensated elsewhere in the geometry. The gain is real but limited by the physics of foam cell structure.
- Thermoformed wet-press moulded pulp achieves better nesting than transfer-moulded because wall thickness is thinner and more dimensionally consistent. Transfer-moulded pulp has advantages in other areas, but nesting performance is not one of them.
- Complex multi-cavity trays with tall internal product-locating pillars will not achieve 1:10 ratios regardless of design effort. The product geometry sets a ceiling. The nesting savings cited in this article apply most directly to end-caps, corner protectors, flat trays, and similar protective forms that represent the majority of industrial moulded pulp volume.
- Fraunhofer IML’s logistics benchmarking reports and VDMA internal logistics cost methodology are both publicly available and provide the reference figures used in the cost calculations above. They are worth pulling before you build your own business case, because the numbers vary by facility type and region.
FAQ
What is nesting ratio in packaging and why does it matter?
Nesting ratio describes how many empty units stack into the space of one when units are placed inside each other. A ratio of 1:8 means eight units fit in the height of one. It matters because empty packaging has to live somewhere before it gets used, and in production environments with significant volume, that storage footprint is a real cost. Better nesting means fewer pallet positions, fewer forklift moves, and lower inbound freight cost per unit.
Is the nesting advantage automatic when switching from EPS to moulded pulp?
No. This is probably the most important thing to understand before starting a transition. Moulded pulp has the wall thickness to support excellent nesting, but only if the geometry is designed with nesting as a specific requirement. A moulded pulp part designed to replicate an EPS shape will often nest no better than the EPS part it replaces. Draft angles, flange design, and cavity taper all have to be set up for stacking performance from the start of the design process.
What nesting ratio should I ask my moulded pulp supplier for?
For standard protective packaging forms, a nesting ratio between 1:8 and 1:10 is achievable and reasonable to specify. Ask your supplier to confirm the ratio from their draft geometry, not just claim it generically. If they cannot give you a specific figure based on the actual part design, the nesting performance was not engineered.
How do I calculate the actual cost savings from better nesting?
Three inputs: your current nesting ratio for the EPS parts being replaced, your cost per pallet position per month (Fraunhofer IML benchmarks put this at EUR 12 to 18 in German and Austrian facilities), and your cost per internal forklift move (VDMA methodology puts this at EUR 3 to 7 per cycle). From those three numbers and your actual packaging volume, the calculation is straightforward arithmetic. It is worth doing before tooling approval, not after.
Does better nesting affect the structural performance of the packaging?
It can. Thinner walls and steeper taper angles that improve nesting reduce compressive load capacity. Whether this matters depends on your drop test requirements. A competent moulded pulp design engineer works both constraints simultaneously and should be able to show you where the trade-offs land for your specific application. It is not a reason to avoid specifying nesting requirements; it is a reason to do the structural analysis at the same time rather than sequentially.
What reference sources cover moulded pulp logistics performance?
The ECMA (European Carton Makers Association) and PIDA (Packaging Industry Development Association) publish technical guidance on moulded pulp design. Fraunhofer IML in Stuttgart publishes annual logistics benchmarking data covering pallet position costs and internal transport costs across European manufacturing facilities. For EPS performance data, EUMEPS (European Manufacturers of EPS) publishes technical specification guidelines that include wall thickness and structural performance data. These are the primary reference points for any business case calculation.
If nesting is not already in your packaging specification as a numbered requirement with a target ratio, it probably will not be designed for. Suppliers respond to what is written in the brief. Everything else is assumed to be optional.